


Using a date dimension table in Power BI is a practical approach as it enhances the analysis of time-based data, provides granularity control over date attributes (e.g. months, weeks, weekend or holidays), improves visualization, and supports advanced analytics such as forecasting and seasonality analysis.
A date dimension table should cover all of the dates within a specified covered period (e.g. all dates from January 1, 2020, to December 31, 2020) and typically has the following attributes:
Full Date - formatted in a standardized way (e.g., MM-DD-YYYY) and with data type as
date.Day - The day of the month (e.g., 1, 2, 3...31).
Month and/or Month Number - The name and/or number representing the month (e.g., January, February, 1, 2...12).
Day of week - The name or number representing the day of the week (e.g., Monday, Tuesday, 1, 2...7).
Week Number - The number indicating the week of the year (e.g., 1, 2, 3...52).
Quarter - The quarter of the year (e.g., Q1, Q2, Q3, Q4).
Custom attributes such as a holiday indicator that flags whether the date is a holiday, and a weekend indicator that flags whether the date is a weekend, among others.
There are various ways to build a date dimension table into Power BI such as importing the table from Excel (which means the table was made in Excel, presumably in a manual fashion). The easier and more scalable way to create the table is using Power Query M language.
Navigate to Power Query Editor
First, go to Get Data and then to Blank Query to open the Power Query Editor.

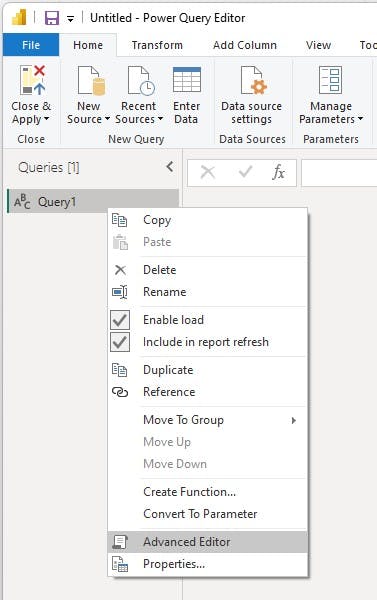
Inside the left section of the Power Query Editor, you'll see the Query that's created (it's Query1 in my case). Right-click on it and then click Advanced Editor.
Overwrite Codes into Power Query M Editor
You've now accessed the Power Query M language editor which we'll use to create the function to build the date dimension table.
Copy this code and paste it inside the Power Query M language editor (just overwrite what's inside of the editor).
//Create Date Dimension
(StartDate as date, EndDate as date) =>

let
    //Capture the date range from the parameters
    StartDate = #date(Date.Year(StartDate), Date.Month(StartDate),
    Date.Day(StartDate)),
    EndDate = #date(Date.Year(EndDate), Date.Month(EndDate),
    Date.Day(EndDate)),

    //Get the number of dates that will be required for the table
    GetDateCount = Duration.Days(EndDate - StartDate),

    //Take the count of dates and turn it into a list of dates
    GetDateList = List.Dates(StartDate, GetDateCount,
    #duration(1,0,0,0)),

    //Convert the list into a table
    DateListToTable = Table.FromList(GetDateList,
    Splitter.SplitByNothing(), {"Date"}, null, ExtraValues.Error),

    //Create various date attributes from the date column
    //Add Year Column
    YearNumber = Table.AddColumn(DateListToTable, "Year",
    each Date.Year([Date])),

    //Add Quarter Column
    QuarterNumber = Table.AddColumn(YearNumber , "Quarter",
    each "Q" & Number.ToText(Date.QuarterOfYear([Date]))),

    //Add Week Number Column
    WeekNumber= Table.AddColumn(QuarterNumber , "Week Number",
    each Date.WeekOfYear([Date])),

    //Add Month Number Column
    MonthNumber = Table.AddColumn(WeekNumber, "Month Number",
    each Date.Month([Date])),

    //Add Month Name Column
    MonthName = Table.AddColumn(MonthNumber , "Month",
    each Date.ToText([Date],"MMMM")),

    //Add Day of Week Column
    DayOfWeek = Table.AddColumn(MonthName , "Day of Week",
    each Date.ToText([Date],"dddd"))

in
    DayOfWeek

Click Done. The UI inside the Power Query Editor should now display the input parameters to specify the covered date period of the Date dimension table.
Specify the Covered Date Period
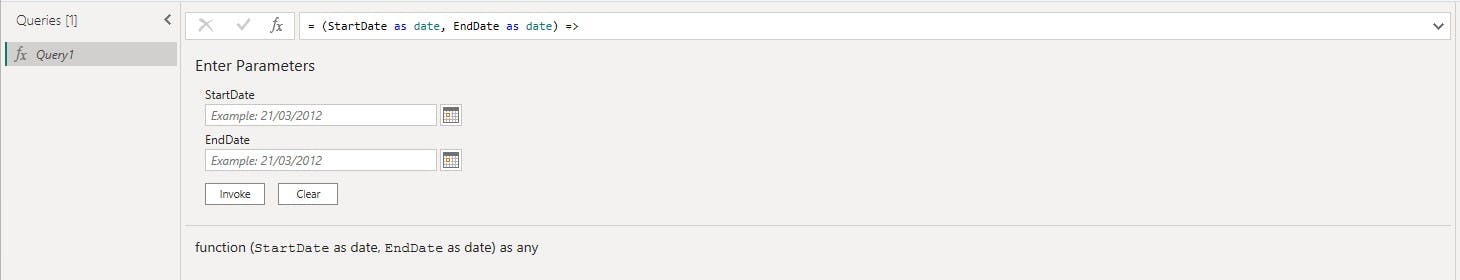
Generally, you can set define the covered period based on the date coverage of your table. For example, if you have a Sales table that has transactions that span from January 2020 to December 2021, the parameters to define have to be 01/01/2020 for the StartDate and 12/31/2021 for the EndDate. You may extend the EndDate to further dates in 2022 and beyond if you are trying to make a forecasting data model.
Note: The input parameters accept dates with dd/mm/yyyy format.
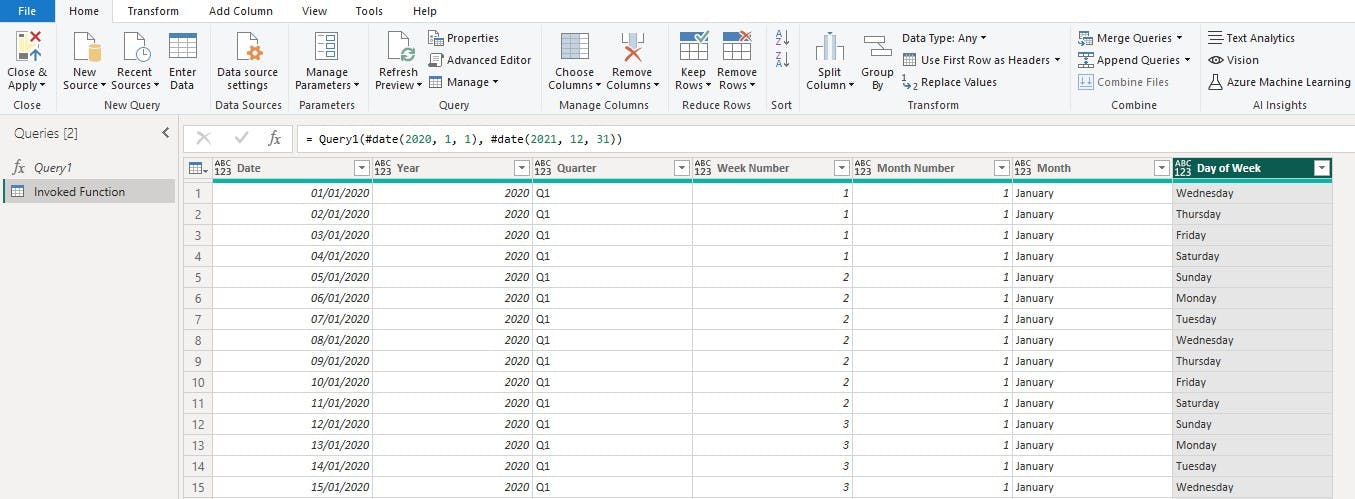
Once you've determined and entered the covered period, click the Invoke button. A table named Invoked Function should instantly create. I prefer renaming the table as DimDate, but Date name should also do.
Conclusion
You've now created the date dimension table, which can be used to make a relationship with a fact table when making a data model in Power BI. The Date column will act as the primary key to define the relationship and the attributes of the date dimension table will form part of the filter context for data visualization purposes.